Amazon New-to-Brand Metrics: Your 2026 Practitioner Guide

Amazon’s new-to-brand (NTB) metrics tell you exactly how many of your ad-driven sales came from customers who hadn’t bought from your brand on Amazon in the previous 12 months. That single data point is the closest thing the platform gives you to a customer acquisition cost calculation. You’ll find NTB data natively in Sponsored Brands, Sponsored Display, Amazon DSP, and Sponsored TV reports, and via Amazon Marketing Cloud (AMC) and the Reporting API.
The five core metrics to pull immediately:
- New-to-brand orders — count of first-time brand purchases in the attribution window
- New-to-brand sales — dollar value of those orders
- % of orders new-to-brand — NTB orders divided by total orders
- % of sales new-to-brand — NTB sales divided by total sales
- New-to-brand units — individual units bought by new customers
Pro Tip: Before reallocating any Sponsored Brands budget, open the campaign-level report, add the NTB columns, and sort by % of orders new-to-brand. Campaigns sitting below 30% on a non-branded keyword are likely retargeting existing customers at acquisition prices.
Key Takeaways
Amazon’s new-to-brand metrics give advertisers a direct measure of customer acquisition efficiency, and the 2026 attribution update makes reading them correctly more important than ever.
| Point | Details |
|---|---|
| 12-month brand-level lookback | A shopper is NTB only if they haven’t purchased from your brand on Amazon in the past 12 months. |
| NTB CAC is the acquisition KPI | Divide total ad spend by NTB orders; optimize acquisition campaigns on this, not ACoS. |
| Sponsored Products has no native NTB | Use AMC or Amazon Attribution to access NTB signals for Sponsored Products spend. |
| 2026 attribution shift changes counts | The January 1, 2026 shopping-signal last-touch update can move NTB numbers without any real behavior change. |
| Run 21-day validation windows | Match your observation window to your product’s sales cycle before drawing conclusions from NTB data. |
Table of Contents
- What does “new to brand” actually mean on Amazon?
- Where do NTB metrics appear, and where are they missing?
- How Amazon determines “new” and what the 2026 attribution changes mean for your data
- Core NTB formulas and how to interpret them
- Concrete optimizations you can run this week
- What NTB does not tell you, and the pitfalls that trip up most advertisers
- How to pull NTB metrics and calculate NTB rate and NTB CAC
- How Selloop uses NTB to validate acquisition experiments
- Why NTB matters more in 2026 than it ever did before
- Sources
What does “new to brand” actually mean on Amazon?
Amazon defines a shopper as new-to-brand if they have not purchased from that brand on Amazon within the previous 12 months. The lookback is brand-level, not ASIN-level. A customer who bought a different product in your catalog six months ago is not new-to-brand, even if they’re buying a product they’ve never seen before.
| Metric | What it counts |
|---|---|
| New-to-brand orders | Orders placed by shoppers with no brand purchase in the past 12 months |
| New-to-brand sales | Revenue from those orders |
| % of orders new-to-brand | NTB orders ÷ total attributed orders |
| % of sales new-to-brand | NTB sales ÷ total attributed sales |
| New-to-brand units | Units purchased by NTB shoppers |
Amazon also evaluates detail page views (DPVs) in its long-term sales (LTS) models, which estimate incremental revenue a campaign can generate over the next 12 months by crediting early-funnel engagements that eventually convert. For products with a 60-to-90-day consideration cycle, a shopper who viewed your detail page in January and bought in March still counts as NTB at purchase — the 12-month window is generous enough to capture most categories, but it can still undercount for high-ticket items with multi-year repurchase cycles.
Where do NTB metrics appear, and where are they missing?
Surfaces that report NTB natively:
- Sponsored Brands (campaign and keyword level)
- Sponsored Display (audience and product targeting reports)
- Amazon DSP and Store ad reporting
- Sponsored TV
- Amazon Marketing Cloud (AMC) for custom query-level analysis
- Reporting API and the Amazon Ads reporting field reference
- Amazon Attribution, which tracks NTB alongside add-to-cart and purchases in cross-channel setups
Surfaces where NTB is not natively available:
- Sponsored Products standard dashboard (the metric columns simply don’t appear)
- Some third-party inventory and off-Amazon placements
Industry explainers confirm that Sponsored Products is the most common gap advertisers hit. The workaround is AMC: you can join Sponsored Products impression and click data with purchase events in an AMC query to approximate NTB behavior, though it requires SQL-level access and isn’t a direct equivalent.
To find NTB in the console: go to Reports > Report builder, select Sponsored Brands or Sponsored Display, and add the NTB metric columns. At the campaign level, the columns also appear under the Columns selector in the standard campaign table. For API access, the field names follow the pattern newToBrandOrders, newToBrandSales, and newToBrandOrdersPercentage in the Ads reporting API.
Pro Tip: Check the Seller Central forums for screenshots of exactly where NTB column labels appear in different console views — the naming has shifted slightly across updates, and the forum threads often show the current UI faster than the help docs.
How Amazon determines “new” and what the 2026 attribution changes mean for your data
The 12-month lookback runs at the brand level across all Amazon purchases. When a shopper clicks your ad and buys, Amazon checks their purchase history: any brand purchase in the past 12 months disqualifies them from NTB status. Detail page views factor into the LTS model but not into the standard NTB order count itself.
The bigger shift for 2026 is attribution. Amazon introduced a shopping-signal enhanced last-touch attribution model effective January 1, 2026, which changes how certain ad views receive conversion credit. This affects Store ad inventory specifically and can raise or lower apparent NTB counts without any real change in shopper behavior.
| Attribution model | What it credits | Effect on NTB counts |
|---|---|---|
| Shopping-signal enhanced last-touch | Credits the ad view most closely tied to a purchase signal | May shift credit away from earlier touchpoints; NTB counts can drop or rise |
| Purchases (all views, 14-day) | Credits any ad view within 14 days before purchase | Broader credit; typically higher attributed NTB orders |
Pro Tip: Always pull both “Purchases (shopping-signal last-touch)” and “Purchases (all views)” columns side by side. The gap between them shows how much discovery credit your ads are generating versus direct last-click conversions. A large gap means your upper-funnel is working; a small gap means shoppers are mostly clicking and buying immediately.
Core NTB formulas and how to interpret them
Three calculations cover most acquisition decisions:
- NTB rate = New-to-brand orders ÷ total attributed orders
- NTB sales % = New-to-brand sales ÷ total attributed sales
- NTB CAC (customer acquisition cost) = Total ad spend ÷ number of NTB orders
NTB CAC is the number that connects your ad budget to real acquisition economics. To calculate NTB CAC, divide your ad spend by the number of NTB orders. Whether that’s acceptable depends on your product’s lifetime value, not on ACoS alone.
Third-party benchmarks suggest NTB% varies widely by format and targeting type: branded keyword campaigns typically show lower NTB% (existing customers search by brand name), while category and competitor keyword campaigns tend to run higher. Treat these as directional signals rather than hard targets, since category, price point, and repurchase rate all shift the baseline.
Pro Tip: For acquisition campaigns, optimize on NTB CAC, not ACoS. Campaigns with higher NTB rates are acquiring new customers more efficiently than those with lower NTB rates.
Concrete optimizations you can run this week
- Enable the NTB audience bid boost in Sponsored Brands. Amazon built a New-To-Brand Shoppers audience specifically for this. Advertisers who increased bids by 100% or more on this audience saw roughly 2x more NTB orders in initial reports. Start with a moderate boost, run the campaign for a few weeks, then compare NTB CAC before and after.
- Separate acquisition and retention campaigns. Run branded keywords in one campaign (retention, optimize on ACoS) and category or competitor keywords in another (acquisition, optimize on NTB CAC). Mixing them obscures both signals.
- Add a views remarketing exclusion list. In DSP and Sponsored Display, exclude shoppers who have already viewed your detail page in the past 30 days. This pushes budget toward genuinely new audiences and keeps your NTB% from being diluted by retargeting.
- Test upper-funnel keyword and category targeting. Generic category terms attract shoppers who don’t know your brand yet. These campaigns often show higher NTB% than branded terms, making them the right place to invest when the goal is acquisition.
- Set a reporting cadence of every 21 days for acquisition experiments. NTB data has a reporting lag, and most purchase decisions need at least two weeks to fully attribute. A 21-day window captures the bulk of conversions without letting noise accumulate.
Pro Tip: When running a bid-boost experiment on the NTB audience, allow sufficient time for attribution before evaluating results. The attribution window for view-based conversions runs up to 14 days, so early reads will undercount NTB orders and make the experiment look worse than it is. Check your 2026 Amazon ad optimization playbook for a full experiment framework.
What NTB does not tell you, and the pitfalls that trip up most advertisers
NTB is a useful signal, but it has real limits that are easy to overlook:
- Platform-only history. Amazon only checks its own purchase records. A shopper who bought your brand at Target last month is “new-to-brand” on Amazon even though they’re a repeat customer. NTB overstates true acquisition for brands with strong off-Amazon presence.
- 12-month window may be too short. For high-consideration products (furniture, appliances, B2B supplies), a shopper who bought 14 months ago is effectively a new customer, but the lookback misses them. NTB% will undercount acquisition for these categories.
- Attribution and privacy-driven sampling. Some NTB data is sampled, particularly in DSP and AMC. Small campaigns may show unstable NTB percentages week to week simply due to sample size.
- Delayed data. NTB metrics can lag by 24–72 hours in standard reports. Don’t make bid changes based on same-day NTB reads.
- Reporting surface restrictions. Sponsored Products still lacks native NTB columns, so a significant portion of most sellers’ spend sits in a blind spot.
A warning worth stating plainly: the January 1, 2026 attribution update can shift NTB counts up or down for Store ad inventory without any change in actual shopper behavior. If your NTB numbers moved significantly at the start of 2026, check whether the affected inventory is in scope before drawing conclusions.
Third-party analysis consistently recommends not using NTB in isolation.
Pro Tip: Combine NTB with first-time coupon redemptions, buyer email list growth, or AMC cohort analysis before making major budget shifts. Any two of these pointing in the same direction gives you a much stronger signal than NTB alone.
How to pull NTB metrics and calculate NTB rate and NTB CAC
- In the Amazon Ads console, go to Reports > Report builder.
- Select Sponsored Brands as the ad product and set the date range to the last 21 days (or match your product’s typical sales cycle).
- Add columns: New-to-brand orders, New-to-brand sales, Total orders, Total sales, Total spend.
- Export the report as a CSV.
- In your spreadsheet, add a column: NTB rate = New-to-brand orders ÷ Total orders.
- Add a second column: NTB CAC = Total spend ÷ New-to-brand orders.
- Sort by NTB CAC ascending to find your most efficient acquisition campaigns.
- For API access, query the
newToBrandOrdersandnewToBrandSalesfields via the Ads reporting API; the field names are consistent across Sponsored Brands and Sponsored Display endpoints.
For a cross-channel view, Amazon Attribution surfaces NTB alongside standard retail metrics, letting you compare acquisition efficiency across paid search, social, and display outside Amazon.
Pro Tip: Match your observation window to your product’s sales cycle. A consumable with a 7-day repurchase cycle needs only a 14-day window. A supplement or skincare product with a 30-day cycle needs at least 35 days to capture most conversions. Using a window that’s too short will systematically undercount NTB orders and inflate your apparent NTB CAC.
How Selloop uses NTB to validate acquisition experiments
The workflow Selloop runs for NTB-driven optimization follows four steps: identify, change, monitor, validate.
Identify: Selloop flags campaigns with high spend and low NTB rate — for example, a Sponsored Brands campaign spending heavily on category keywords but showing a NTB% below what the format typically delivers. That’s a signal the budget is reaching existing customers rather than new ones.
Change: Apply a targeted fix: enable the NTB audience bid boost, restructure to separate acquisition and retention targeting, or shift budget toward higher-NTB keyword groups.
Monitor: Track NTB orders, NTB sales, NTB CAC, and overall ACoS daily over a 21-day window. The campaign health score gives a composite read on whether the campaign is moving in the right direction without requiring manual spreadsheet work.
Validate: At day 21, compare before-and-after NTB CAC. If NTB CAC dropped while overall ACoS held steady or improved, the change worked. If NTB CAC rose, the bid boost or targeting shift overcorrected.
Metrics Selloop tracks through the validation window:
- NTB orders (absolute count and week-over-week trend)
- NTB sales and NTB sales %
- NTB CAC
- Overall ACoS
- Change delta (the specific bid, keyword, or audience adjustment made, with the date it was applied)
Pro Tip: Use both shopping-signal last-touch and Purchases (all views) during the validation window. If NTB orders in the all-views column grow faster than in the last-touch column, your bid boost is generating discovery that converts later, not just immediate clicks. That’s the pattern you want from an upper-funnel acquisition push.
Why NTB matters more in 2026 than it ever did before
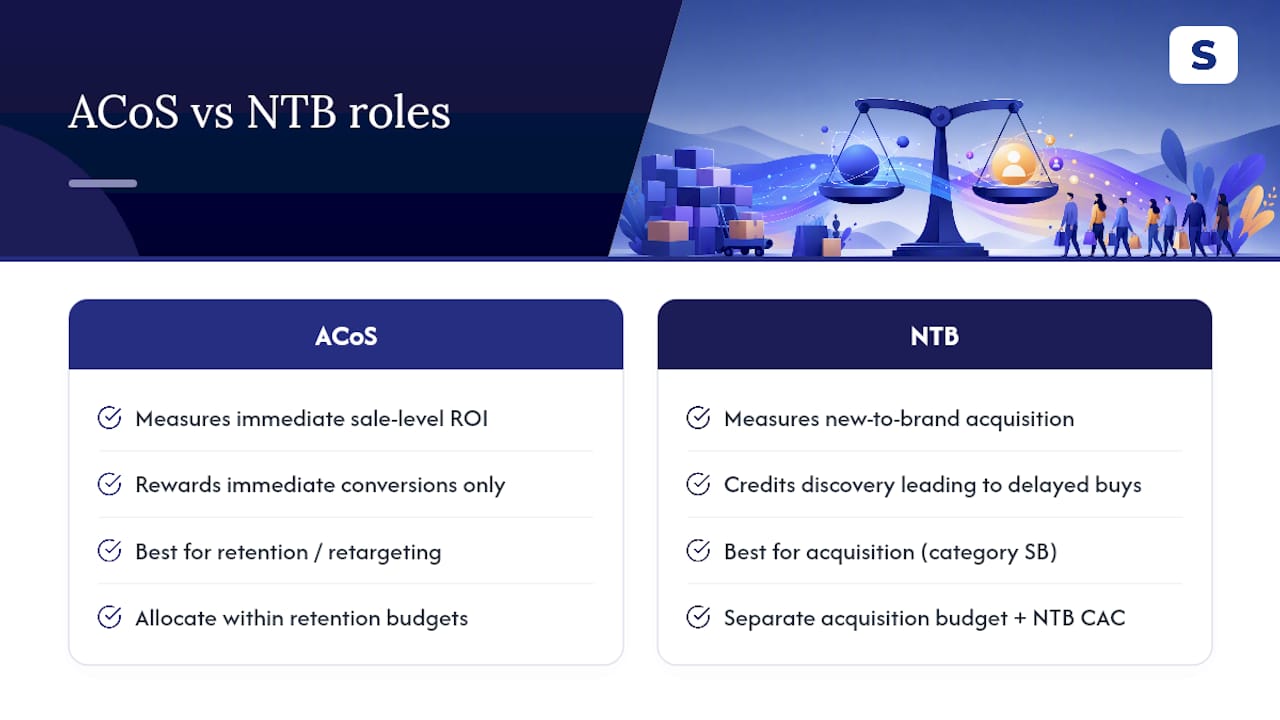
For most of Amazon advertising’s history, ACoS was the number that ran the room. It’s clean, it’s immediate, and it fits neatly into a P&L. The problem is that ACoS treats a sale to a loyal repeat customer and a sale to someone who’s never heard of your brand as identical events. They’re not.
Amazon’s shift toward long-term sales metrics and the 2026 attribution update are a direct acknowledgment of that gap. By giving discovery credit to ad views that lead to purchases weeks later, the platform is finally building the infrastructure to reward upper-funnel investment. NTB is the metric that sits at the center of that shift. It’s the bridge between “did this ad generate a click?” and “did this ad grow my customer base?”
Advertisers who keep optimizing purely on ACoS in 2026 will systematically underfund their acquisition campaigns. A Sponsored Brands campaign targeting category keywords will almost always look worse on ACoS than a branded retargeting campaign. But the category campaign is the one building the business.
The practical implication: set a separate acquisition budget with a NTB CAC target, treat it as a customer development investment, and evaluate it on a 21-to-35-day window that matches your sales cycle. ACoS belongs on retention campaigns. NTB CAC belongs on acquisition ones.
Pro Tip: In the initial period after a product launch or entering a new category, NTB% is typically very high by definition. Use that window to establish your baseline NTB CAC before the audience matures. That number becomes your benchmark for every acquisition experiment you run afterward.
Sources
Official Amazon documentation and vetted third-party explainers used in this article:
- Sponsored ads new-to-brand metrics
- What is New-to-Brand (NTB) on Amazon? | Complete Guide | Headline
- Amazon’s ‘New to Brand’ metrics and how can brands use … - This is Unicorn
Metric names and field labels in the Ads console and API are updated periodically. Always verify current naming against the reporting builder in your account before building automated reports or dashboards.
Selloop tracks every campaign change you make and measures NTB orders, NTB CAC, and overall ACoS over a 21-day window, so you can see whether your acquisition experiments actually worked. No spreadsheets, no manual before-and-after pulls. Try Selloop free for 7 days and run your first NTB experiment with a clear validation framework already built in.