Cross account reporting means pulling performance data from several ad or platform accounts into one consolidated view so you can compare and report results without switching logins. For a single-platform portfolio, start with the platform’s own manager-account reporting, such as Google Ads’ manager account cross-account tools. For multi-platform or large-scale needs, move to a BI connector pipeline. Either way, lock down reporting permissions and agree on metric definitions before you build anything.
TL;DR:
- Use native platform reporting for fewer than a dozen accounts on one platform; switch to BI connectors or dashboards for multi-platform or larger portfolios.
- Ensuring consistent metric definitions, currencies, conversion windows, and time zones across accounts prevents data discrepancies and faulty aggregations.
- Grant read-only cross-account access via IAM roles with strict permission controls and regularly review assumed-role activity to prevent scope creep.
- Automate data extraction and normalization with ETL pipelines for complex needs, but be mindful of API limits, data sampling, and reporting frequency to maintain accuracy.
- Share reports via platform-native scheduling and export formats, verifying totals and date ranges before distribution to ensure data reliability.
Table of Contents
- Comparing the main approaches to cross account reporting
- Platform-specific setup notes and common pitfalls
- Standardizing metrics, currency, and time windows
- Security and permissions for safe cross-account access
- Automating cross-account reporting with connectors and dashboards
- Scheduling, exporting, and sharing reports reliably
- A practitioner’s take on when to automate cross-account reporting
- Simplifying aggregated reporting and optimization for Amazon ads
- FAQ
- Sources
Comparing the main approaches to cross account reporting
Four approaches cover almost every scenario you will run into, and all trades speed for control differently.
Manager-account or native reporting uses the ad platform’s own tools, like a Google Ads manager account (MCC) or Meta’s Ads Reporting, to view multiple accounts in one place without exporting anything. It is fast to set up and stays current automatically, but it only works within one platform and offers limited customization.
BI connectors and data blending (Looker Studio, Tableau, Power BI) pull from several accounts or platforms into a shared dashboard. They scale across platforms and support custom metrics, but someone has to build and maintain the connections.
Aggregated dashboards built on top of a data warehouse give the most flexibility and the cleanest long-term source of truth, at the cost of real engineering time.
Spreadsheets with manual exports remain common for small portfolios: cheap, flexible, and immediate, but error-prone and tedious to refresh as you add accounts.
Setup time, data freshness, and error risk move together:
- Native reporting: minutes to set up, real-time data, low error risk, single platform only.
- Spreadsheets: hours per refresh cycle, stale data, high error risk, unlimited platforms in theory.
- BI connectors: days to configure, near-real-time once built, moderate error risk, multi-platform.
- Aggregated dashboards: weeks to build, real-time with proper pipelines, low error risk once validated, unlimited scale.
A simple decision rule works for most teams:
- If you manage one platform and fewer than a dozen accounts, use native manager-account reporting.
- If you manage two or three platforms or need custom metrics, build a BI connector dashboard.
- If you manage dozens of accounts across platforms with compliance or audit needs, invest in a proper aggregated dashboard backed by an ETL pipeline.
Platform-specific setup notes and common pitfalls
Each platform handles cross-account data differently, and the gotchas are where most reports break.
Google Ads manager accounts (MCC). Set up cross-account conversion tracking from the manager account level using a single Google tag (gtag.js) shared across client accounts. This consolidates attribution and avoids duplicate tags, but an account cannot run account-specific and cross-account conversion actions at the same time. When migrating, leave old tags active temporarily so you do not lose conversions during the switchover. Switching conversion-action ownership from a client account to the manager level can also change which conversion goals campaigns optimize toward, so verify campaign goals after the switch. For spend totals, manager accounts with client accounts in different currencies need the converted currency layer turned on; without it, mixed-currency spend totals will simply be missing from the rollup, and Smart Bidding strategies tied to those conversion actions can behave inconsistently if goals shift mid-campaign.
Meta Ads Reporting. Cross-account reports live inside Ads Reporting, where you can group multiple ad accounts under one view, schedule recurring exports, and share them with teammates who hold at least reporting-level access to each account. Permissions matter here too: a user needs analyst or reporting access on every account included, not just the primary one.
AWS CloudWatch cross-account observability. For telemetry rather than ad spend, CloudWatch supports a monitoring-account model where one account can observe telemetry from up to 100,000 source accounts using Observability Access Manager. Some methods, like cross-account cross-Region console switching, do not move the telemetry itself, while centralization copies it into a destination account. Sinks and sink policies control exactly which telemetry types get shared, and AWS Organizations can auto-onboard new accounts as they join.
Looker Studio blending. Create a separate data source per account, then join them carefully. Blends fail most often when query types or schemas do not match between sources, so a clear naming convention that includes account identifier and query type prevents accidental joins of incompatible data. When blending keeps breaking, that is usually the signal to normalize data through a proper ETL step before it ever reaches the dashboard.
Pro Tip: Keep one tab or sheet documenting which conversion actions, tags, and permissions live at the manager level versus the account level. It saves hours when something breaks.
Standardizing metrics, currency, and time windows
Consolidated reports only mean something if every account defines its numbers the same way. A data dictionary, even a simple shared document, should spell out what counts as a conversion, a session, or a qualified lead across every account feeding the report.
Currency normalization deserves its own rule: never sum raw totals across accounts in different currencies. Apply a conversion layer, as Google Ads does with its converted currency view, and store both the local and converted figures so you can audit either one later.
Time windows cause quieter errors. Conversion windows, attribution models, and timezones need to match across accounts, or the same campaign can show different numbers depending on which account’s settings it inherited.
A short onboarding checklist keeps new accounts from introducing drift:
- Confirm the account’s currency and apply the conversion layer if it differs from the reporting standard.
- Match its conversion window and attribution model to the rest of the portfolio.
- Align its reporting timezone with the consolidated report.
- Add its metric definitions to the shared data dictionary before the first report run.
Standardized metric definitions applied at ingestion prevent the kind of rollup errors that undermine decision-making once a report scales past a handful of accounts.
Security and permissions for safe cross-account access
Granting read access across accounts should never mean handing out full admin rights. Cross-account IAM roles let a principal in one AWS account assume a role in another through a trust policy, which centralizes permission management without creating duplicate users in every account.
For reporting, the permission set should stay narrow:
- Read-only access to the specific metrics, dashboards, or logs needed for the report.
- No write, delete, or configuration permissions on the source account.
- A unique external ID on the trust relationship to prevent confused-deputy problems.
- Distinct role session names per user or job, so CloudTrail logs show exactly who accessed what and when.
The practical risk with cross-account roles is scope creep: a role created for one report quietly gets reused for something broader. Review assumed-role activity periodically and retire roles tied to reports that no longer run.
Automating cross-account reporting with connectors and dashboards
Native connectors handle single-platform, straightforward needs well. Once you are pulling from multiple platforms or need custom joins, a dedicated ETL or BI connector becomes worth the setup time.
A typical automated pipeline follows four steps:
- Extract data from each account’s API on a scheduled basis.
- Normalize metric names, currencies, and time windows against the shared data dictionary.
- Store the normalized data in a warehouse or staging table.
- Visualize it in a dashboard that refreshes on a fixed schedule.
A few operational details decide whether this pipeline stays reliable. API rate limits and data sampling can quietly shrink the accuracy of pulled data if extraction jobs run too frequently or too close together. Refresh windows should match how often stakeholders actually check the report, not the platform’s maximum frequency. Cost adds up fastest with connector tools billed per data source or per row processed, so audit which accounts actually need near-real-time refreshes versus daily batches.
Reconciliation and alerting round out a mature setup: a scheduled check that compares pipeline totals against a spot-check pull from the source account catches silent failures before a stakeholder does.
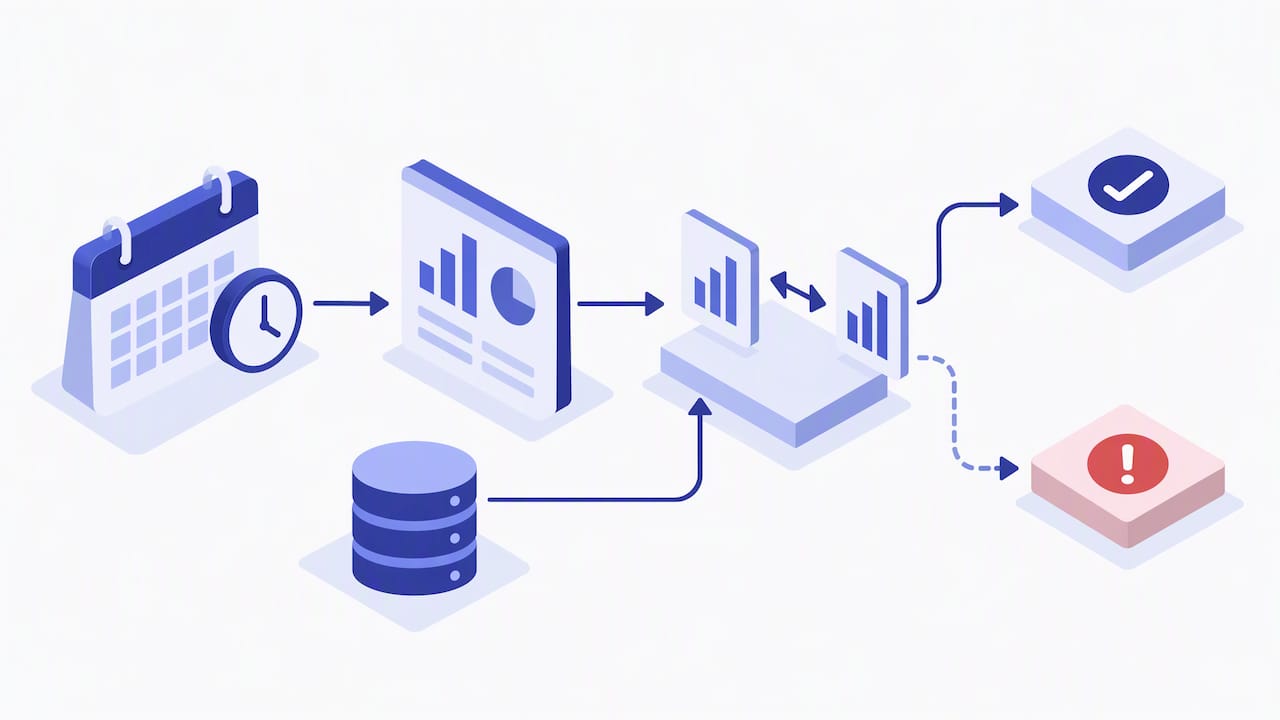
Pro Tip: Set a reconciliation job to run right after each scheduled refresh, comparing a handful of key totals against the source platform directly. A mismatch there is almost always caught faster than a stakeholder noticing a wrong number in a dashboard.
Scheduling, exporting, and sharing reports reliably
Distribution is where good data pipelines lose credibility if access or format gets sloppy.
- Use each platform’s native scheduling where available (Google Ads, Meta Ads Reporting) for simple recurring exports, and fall back to BI tool scheduling for custom or blended reports.
- Choose export format by audience: CSV for further analysis, PDF for static executive summaries, live dashboard links for teams that need to drill into numbers themselves.
- Share through access-controlled links with expiration dates rather than open PDFs, especially when client or partner accounts are involved.
- Before distributing, spot-check totals against the source account and confirm the date range matches what the recipient expects.
A practitioner’s take on when to automate cross-account reporting
Building your own consolidated reporting pipeline makes sense when you have engineering time and genuinely unusual metric needs. For most Amazon sellers and agencies juggling PPC accounts, the bigger bottleneck is not visibility into the numbers, it is deciding what to do with them. Selloop specializes in analyzing Amazon PPC campaigns with AI to flag where spend is inefficient, and it tracks every applied change so you see a data-justified verdict on what actually worked, not just a rolled-up spend total. If your reporting problem is really an optimization problem, trial a tool before building a pipeline.
— Selloop
Simplifying aggregated reporting and optimization for Amazon ads
A consolidated report tells you what happened across accounts. It rarely tells you what to fix next, which is the gap our platform is built to close. Instead of exporting spend data and guessing which campaigns are draining budget, we analyze campaigns across your managed accounts, flag the ones with high spend and low return, and back every recommendation with the exact data behind it.
Every change you apply gets tracked, so you get a clear verdict on impact instead of another spreadsheet to maintain. This fits sellers running one account and agencies managing several client accounts alike.
- Automated analysis across managed accounts with clear, data-justified recommendations.
- Verdicts on applied changes, with AI insights instead of manual spreadsheet comparisons.
- Plans built for different stages: STARTER at $29 per month, GROWTH at $99 per month, and PRO at $249 per month, with Agencies & Enterprise pricing available on request.
Start a trial on our pricing page to see which plan fits your account count and ad spend.
FAQ
What are the three different types of reporting?
Reporting generally splits into operational reporting (day-to-day metrics for running campaigns), analytical reporting (deeper comparisons and trend analysis across accounts or periods), and strategic reporting (summary views for leadership decisions). Cross account reporting can serve any of the three, depending on whether you are checking daily spend, comparing account performance, or briefing stakeholders.
What does “reporting account” mean?
A reporting account is the account, or in some setups the designated monitoring or manager account, that gathers and displays data pulled from one or more other accounts. In Google Ads, that role belongs to the manager account; in AWS CloudWatch, it is called the monitoring account.
What is a cross account IAM role and how is it used?
A cross-account IAM role lets a user or service in one AWS account assume permissions in another account through a trust policy, without creating a separate login in each account. It is commonly scoped to read-only access for reporting, with an external ID and unique session names used to keep an audit trail of who accessed what.
Why does my manager account show missing spend totals for some accounts?
This usually happens when client accounts use different currencies and the converted currency layer has not been enabled. Turning on converted currency in the manager account view resolves missing or incomplete spend totals across mixed-currency accounts.
How is cross-account reporting different from what a tool like Selloop does?
Cross-account reporting aggregates and displays performance data across accounts, while a tool like Selloop goes a step further by analyzing that data with AI to recommend specific campaign changes and tracking their results. Reporting answers what happened; the optimization layer answers what to change next.
Sources
- Manager Accounts (MCC): Set up cross-account conversion tracking - Google Ads Help
- CloudWatch cross-account observability - Amazon CloudWatch documentation