Amazon Ad Spend Report: Generate, Reconcile, and Act

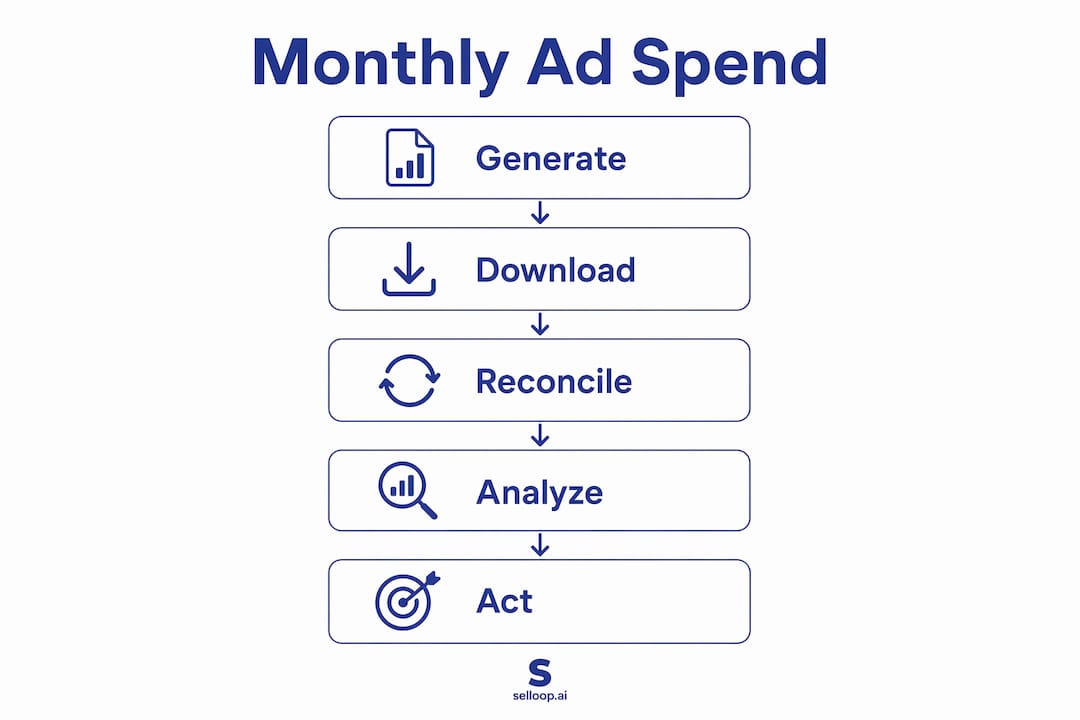
The fastest way to get a month-by-month Amazon ad spend report is to open the Advertising Console, go to Reports > Create Report, select “Campaign” or “Performance Over Time,” set your date range to a single calendar month, and export the CSV. For official billed amounts, go to Payments > Advertising invoice history in Seller Central. Those two sources together give you everything you need for both operational decisions and accounting reconciliation.
Quick-start checklist:
- Log into Seller Central and open the Advertising Console.
- Click Reports in the left navigation, then Create Report.
- Choose report type: “Performance Over Time” for monthly totals, or “Campaign Performance” for campaign-level breakdown.
- Set the date range to the first and last day of the calendar month you’re analyzing.
- Select columns: Cost, Clicks, Impressions, and Attributed Sales at minimum.
- Click Run Report, then Export CSV when it’s ready.
- For billing reconciliation, go to Seller Central > Payments > Advertising invoice history and download the invoice for the same period.
Table of Contents
- Where Amazon stores your ad spend and billing data
- Which Amazon report types actually show spend
- How to generate and schedule a monthly spend report
- How to reconcile report spend with your advertising invoices
- Key spend metrics and how to use them in monthly budget decisions
- Why a 21-day decision window makes your monthly reports more useful
- Key Takeaways
- Monthly reports are a control system, not a scoreboard
- Selloop turns your monthly spend data into decisions you can act on
- Useful sources to bookmark
Where Amazon stores your ad spend and billing data
Two separate interfaces hold your spend data, and they serve different purposes. Mixing them up is the most common source of confusion when sellers try to reconcile their numbers.

The Advertising Console (accessible from Seller Central or directly at advertising.amazon.com) is your operational hub. The Reports menu and Campaign Manager both show spend by campaign, keyword, and product, updated daily. Use this for fast checks on pacing, CPC trends, and campaign-level cost breakdowns. It’s the right tool for asking “where did my budget go this month?”
Payments > Advertising invoice history in Seller Central is the accounting source. It holds the official billed amounts for each billing period, which is what you’ll match to your bank statement or accounting software. Amazon charges your payment method when your account balance hits a billing threshold or at the end of a billing cycle, so the invoice date rarely aligns perfectly with a calendar month.
Timezone matters more than most sellers realize. Amazon reports use Pacific Time (PT) by default, but billing cycles may close at different hours. A campaign that ran at 11 PM on March 31 in New York (ET) may appear in April’s report data if the console records it in PT. Always note which timezone your report window uses before comparing it to an invoice.
Pro Tip: When reconciling, download both the CSV report and the invoice PDF for the same period before touching any numbers. Trying to reconcile from memory or a screenshot almost always introduces errors.
Which Amazon report types actually show spend
Not every report in the Advertising Console includes a Cost column. Here’s how the main types break down and when to use each one in a monthly workflow.

| Report Type | Cost Column? | Best For |
|---|---|---|
| Performance Over Time | Yes | Month-by-month spend totals, trend analysis |
| Campaign Performance | Yes | Campaign-level spend, CPC, impressions, clicks |
| Advertised Product | Yes | ASIN-level spend and attributed sales |
| Search Term | Yes | Keyword-level spend, waste identification |
| Placement | Yes | Top of Search vs. Product Page cost comparison |
| Targeting | Yes | Keyword/target bid-level cost breakdown |
For a clean monthly spend total, Performance Over Time is the simplest pull. It aggregates cost across all campaigns for the date range you select, with no filtering needed.
For diagnosing where spend is going, the Search Term Report is the most tactical. It surfaces high-click, low-order terms you should negate, and winning search terms worth harvesting into exact-match campaigns. The Advertised Product Report does the same job at the ASIN level, showing which products are draining budget without returning attributed sales.
A few important caveats on attribution:
- All Amazon native reports use last-touch attribution within Amazon’s ecosystem. They cannot show touchpoints from external traffic sources, so if you’re running off-Amazon ads, cross-channel attribution requires an external tool.
- Attributed sales figures have a default 14-day attribution window for Sponsored Products (7 days for clicks, 1 day for views on Sponsored Display). A sale that closes 10 days after the click will appear in the report for the click date, not the sale date.
- The Placement Report is underused. It often reveals that Top of Search placements convert at two or three times the rate of Product Page placements, which directly informs where to concentrate budget.
How to generate and schedule a monthly spend report
Here’s the full step-by-step for creating a monthly CSV, setting up a scheduled report, and a note on API access for multi-account sellers.
Generating a one-time monthly report:
- In the Advertising Console, click Reports in the left sidebar.
- Select Create Report.
- Under “Report Type,” choose Campaign for campaign-level data or Performance Over Time for aggregated monthly totals.
- Set “Time Unit” to Daily if you want day-by-day rows, or Summary for a single-row total.
- Set the date range to the exact first and last day of the calendar month (e.g., March 1–March 31).
- Add columns: Cost, Clicks, Impressions, Attributed Sales, CPC, and ACoS.
- Click Run, wait for the report to generate, then click Download.
Setting up a scheduled monthly report:
In the same Reports menu, select Scheduled Reports and click Create Scheduled Report. Choose your report type, set the delivery frequency to Monthly, and pick the delivery date (the 1st or 2nd of the following month works well, giving the prior month time to finalize). Scheduled reports land in your Reports dashboard automatically, and Amazon can also email a download link.
For sellers managing multiple accounts or brands, scheduled reports and the Amazon Advertising API both reduce manual export errors and keep date ranges consistent. The API is the right path if you’re pulling data into a spreadsheet model or a BI tool like Looker Studio or Tableau.
Pro Tip: Name your CSV files with a consistent format: “YYYY-MM_CampaignPerformance.csv” (e.g., “2026-03_CampaignPerformance.csv”). It sounds trivial, but six months from now you’ll thank yourself when you’re comparing March to September without opening every file.
How to reconcile report spend with your advertising invoices
Report totals and invoice totals almost never match exactly. That’s normal, but you need to know why they differ and how large a gap is acceptable.
Reconciliation steps:
- Export the monthly Campaign Performance or Performance Over Time CSV for the billing period.
- Download the corresponding invoice from Payments > Advertising invoice history.
- Sum the Cost column in the CSV and compare it to the invoice total.
- Flag any variance above 2–3% for investigation.
Common reasons for mismatches:
- Timezone differences: Report data uses PT; billing cycles may close at a different cutoff. Clicks near midnight on the last day of the month can fall into the next billing period.
- Invalid-click adjustments: Amazon automatically refunds charges for invalid clicks, which appear as credits on invoices but may not reduce the Cost column in your report retroactively.
- Billing threshold timing: Amazon charges your account when you hit a billing threshold, not at month-end. One invoice may span parts of two calendar months.
- Currency and exchange rates: For sellers running cross-border campaigns (e.g., advertising on Amazon.co.uk from a US account), the invoice may show a converted amount that differs from the report’s base currency.
Accounting checklist:
- Confirm the report date range matches the invoice billing period, not just the calendar month.
- Note any credits or adjustments listed separately on the invoice.
- For cross-border accounts, record the exchange rate used on the invoice date.
- Document variances above your threshold with a one-line note explaining the likely cause.
Key spend metrics and how to use them in monthly budget decisions
Raw spend numbers only matter when you connect them to outcomes. These six metrics are the ones that drive monthly budget decisions.
| Metric | Formula | Healthy Range (Sponsored Products) |
|---|---|---|
| ACoS | Ad Spend ÷ Attributed Sales | Varies by margin; target below gross margin % |
| ROAS | Attributed Sales ÷ Ad Spend | 3x–5x for most categories |
| CPC | Cost ÷ Clicks | Category-dependent; watch for month-over-month spikes |
| TACoS | Total Ad Spend ÷ Total Revenue | Below 10% signals strong organic contribution |
| CTR | Clicks ÷ Impressions | 0.3%–0.5% is typical for Sponsored Products |
ROAS is the inverse of ACoS: a 25% ACoS equals a 4x ROAS. Neither metric tells the full story alone. ACoS ignores organic sales, so a campaign with a 35% ACoS might still be profitable if it’s driving organic rank and your TACoS is 8%.
Monthly decision rules:
- Rising TACoS month-over-month usually signals organic rank is slipping. Your ads are doing more of the revenue work, which means your organic listings need attention (reviews, content, pricing).
- High CPC with low conversion rate is the clearest signal to add negative keywords or pause the targeting. You’re paying for clicks that don’t convert, and no bid adjustment fixes a structural mismatch between the search term and your listing.
- ACoS above your gross margin means you’re losing money on every attributed sale. Calculate your break-even ACoS as: (Gross Margin %) = Break-Even ACoS. If your margin is 30%, any ACoS above 30% is unprofitable.
Allocating budget by product job beats using a flat revenue percentage. A new launch SKU might justify a 50% ACoS temporarily to build rank and reviews. A mature bestseller should run well below break-even ACoS. Treating every product the same way is how sellers waste budget on campaigns that were never designed to be profitable at the same threshold.
Budget scaling guidance: for new campaigns, starting at $10–$20/day for the first two weeks before scaling gives the algorithm enough data to optimize without burning through budget on untested targeting. When ACoS improves, increase spend by 20–30% at a time rather than doubling overnight.
Pro Tip: TACoS is the one metric to watch monthly. Pull your total store revenue from Business Reports in Seller Central, divide your total ad spend by that number, and track it month-over-month. A falling TACoS alongside stable or growing revenue is the clearest sign your PPC is working.
Why a 21-day decision window makes your monthly reports more useful
Monthly reports tell you what happened. A 21-day test window tells you whether a specific change caused it.
The workflow is simple: make one controlled change (adjust a bid, shift budget to a higher-performing placement, add a batch of negative keywords), record the start date, and don’t touch that campaign for 21 days. Then pull the report for that 21-day window and compare ACoS, TACoS, and attributed sales to the 21 days before the change.
Why 21 days specifically:
- Amazon’s attribution window for Sponsored Products is up to 14 days for click-based conversions. A 21-day window captures the full attribution tail of the last week’s clicks.
- It’s long enough to smooth out day-of-week variation (weekends vs. weekdays convert differently) without waiting a full month to see results.
- It’s short enough to iterate three or four times within a quarter, which compounds improvements faster than monthly-only reviews.
Example: You notice from your monthly report that Top of Search placements are consuming 60% of your budget but only generating 40% of attributed sales. You increase the Top of Search bid modifier by 20% on one campaign and leave the rest unchanged. After 21 days, you compare placement-level cost and conversion rate. If Top of Search ROAS improved, you roll the change to other campaigns. If it didn’t, you revert without having contaminated your whole account.
Pro Tip: Watch inventory levels during your test window. A stockout or a Buy Box loss mid-test will corrupt the data. If either happens, extend the window or restart the test once inventory is stable.
Tracking changes over a 21-day period is the difference between knowing your monthly numbers and actually understanding what’s driving them.
Key Takeaways
Your monthly Amazon ad spend report is only as useful as the decisions it drives. Pull the Performance Over Time CSV and the Payments invoice for the same period, reconcile them, and use the gap between ACoS and TACoS to set your next month’s budget priorities.
| Point | Details |
|---|---|
| Two sources, two purposes | Use Advertising Console reports for campaign decisions; use Payments > Advertising invoice history for accounting. |
| Reconcile every month | Compare CSV Cost totals to invoice amounts; flag variances above 2–3% and check for invalid-click credits. |
| TACoS over ACoS | TACoS (total ad spend ÷ total revenue) is the monthly metric that reveals true ad dependency and organic health. |
| 21-day test window | Make one change, wait 21 days, then compare ACoS and TACoS before and after — don’t react to daily noise. |
| Selloop automates this | Selloop tracks campaign changes and results over 21 days automatically, removing the need for manual CSV comparisons. |
Monthly reports are a control system, not a scoreboard
Most sellers treat their monthly ad spend report as a scoreboard: did I spend more or less than last month? That framing misses the point entirely.
A monthly report is a control system. It tells you whether the levers you pulled last month actually moved the machine in the direction you intended. The spend number alone is meaningless without TACoS context, without knowing which campaigns drove it, and without a baseline to compare against. A seller who spent $4,000 in March and $4,200 in April hasn’t learned anything useful unless they also know whether attributed sales, organic rank, and gross profit moved in proportion.
The 21-day test window is what turns a passive report into an active feedback loop. Without it, you’re making structural changes to your campaigns and then waiting until the end of the month to see a blended result that mixes the effect of your change with seasonal shifts, competitor activity, and inventory fluctuations. That’s not analysis. That’s guessing with extra steps.
Monthly cadence matters because daily and weekly reviews serve different jobs: daily checks prevent out-of-budget days and catch inventory issues; weekly Search Term Report reviews remove waste and harvest winners. The monthly report is where you make structural decisions about budget allocation, campaign architecture, and which SKUs deserve more investment. Conflating those three cadences is how sellers end up making bid changes every day based on noise and missing the actual trend until it’s too late.
Selloop turns your monthly spend data into decisions you can act on
Pulling a monthly CSV and reconciling it to an invoice is a good start. But the harder problem is knowing which of the hundreds of campaigns, keywords, and search terms in that CSV actually need your attention, and what to do about them.
Selloop analyzes your Sponsored Products and Sponsored Brands campaigns, flags where budget is being wasted, and gives you data-backed recommendations with one-click apply. Every change you approve gets tracked automatically over a 21-day window, so you see exactly whether it worked, without building a single spreadsheet. For sellers who want the monthly reporting discipline described in this article without the manual overhead, Selloop’s AI PPC management starts at €29/month with a 7-day free trial. Start your free trial today and see which campaigns are costing you the most before your next monthly report closes.
Useful sources to bookmark
The following official docs and guides are the most reliable references for Amazon advertising reporting, billing, and budget planning.
- Amazon Ads Help: Understand campaign spend — Official explanation of how Cost is calculated and how charges appear on the Billing page. Bookmark this for reconciliation questions.
- Amazon Ads Help: Return on ad spend (ROAS) — Amazon’s own definitions of ROAS and ACoS, including the formula and how attribution affects both metrics.
- Amazon Ads: Advertising Console and reporting overview — The primary hub for accessing Campaign Manager, scheduled reports, and invoice history.
- Amazon Ads Help: Reporting and billing — Official documentation on report types, scheduling, and billing cycle behavior.
- Emplicit: Ultimate Guide to Amazon PPC Metrics Tracking — Practical breakdown of daily, weekly, and monthly review cadences with specific report recommendations.
- EcomCalcTools: Amazon Ad Budget Guide — Guidance on starting daily budgets, scaling rules, and seasonal CPC planning.
- Podean: Global Amazon Media Q1 2026 Report — Benchmark data on CPC trends, ROAS by market, and Sponsored Ads spend volume across major Amazon marketplaces.