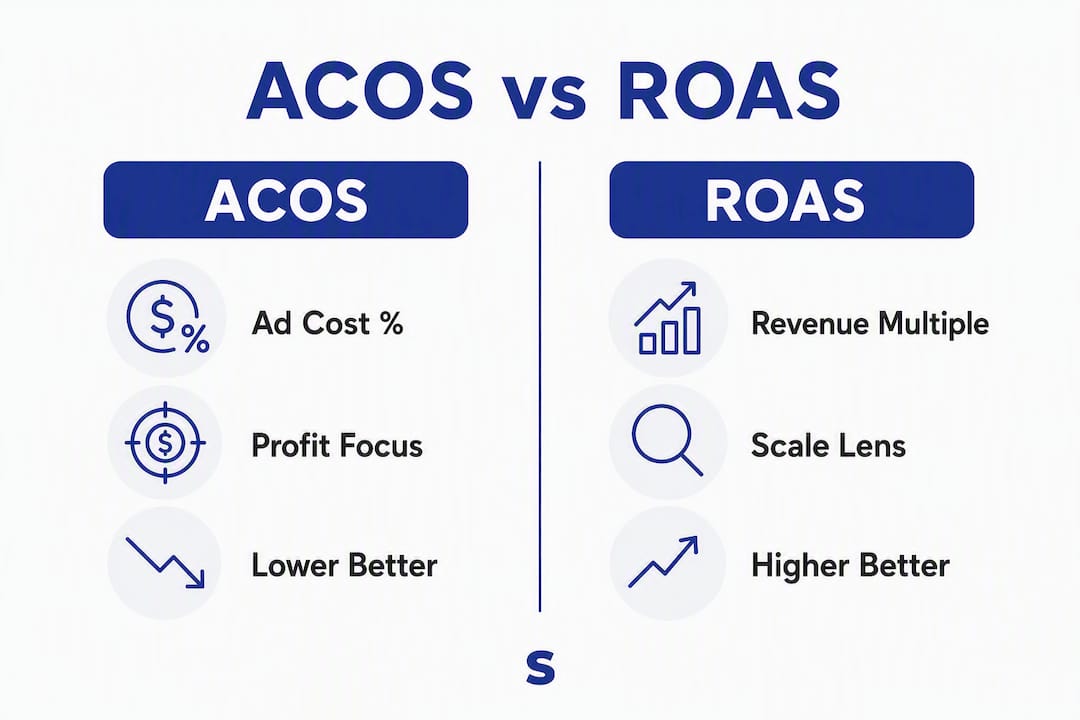
ACOS is your ad cost as a percentage of ad revenue; ROAS is the revenue multiple you earn per dollar spent. They measure the same thing from opposite directions, and the math is exact: ROAS = 100 ÷ ACOS%. A 25% ACOS equals a 4.0 ROAS. A 10% ACOS equals a 10.0 ROAS. No ambiguity, no conversion error.

The decision rule is simple: use ACOS when you’re checking profitability against your margin, and use ROAS when you’re comparing performance across channels or reporting to stakeholders who think in revenue multiples. Amazon Ads surfaces both inside the advertising console, and Amazon recommends using them together rather than picking one.
Here’s what that looks like in practice:
- An ACOS at or below your margin percentage indicates profitability, e.g. if your margin is around 30%, an ACOS near that level or lower means you’re profitable
- An ACOS exceeding your margin percentage indicates a loss, for instance, an ACOS above 30% suggests the campaign is unprofitable if your margin is 30%
- Higher ACOS levels, such as around half of ad-driven revenue, are generally only viable during product launch or brand-building phases
The number that matters most is your break-even ACOS, which comes directly from your product margin. Everything else flows from there.
Table of Contents
- What is ACOS and how do you calculate it?
- What is ROAS and when should you use it?
- How ACOS and ROAS convert into each other
- Why TACoS gives you a picture ACOS and ROAS can’t
- How to lower ACOS and raise ROAS in practice
- How AI tools help you track and improve ACOS and ROAS
- Key Takeaways
- The metric that actually matters is the one tied to your margin
- Selloop spots the ACOS problems you’re too busy to find
- Useful sources
What is ACOS and how do you calculate it?
ACOS (Advertising Cost of Sales) answers one question: what percentage of your ad-driven revenue went back into ads? The formula is:
ACOS = (Ad Spend ÷ Ad-Attributed Revenue) × 100
Say you spent $25 on ads and those ads generated $100 in sales. Your ACOS is 25%. That number only becomes meaningful when you compare it to your product margin.
Break-even ACOS: the number that really matters
Amazon instructs sellers to derive break-even ACOS directly from product-level profit margin. The logic is straightforward: if your margin after COGS, Amazon fees, FBA fees, and shipping is 30%, then any ACOS below 30% means the campaign is contributing profit. Any ACOS above 30% means ads are costing you money on every sale.
To calculate break-even ACOS properly, include every cost that comes out before you pocket revenue: cost of goods, Amazon referral fee (typically 8–15% depending on category), FBA fulfillment fees, and any storage costs. Sellers who skip FBA fees routinely set targets that look profitable on paper but aren’t.
| Ad Spend | Ad Revenue | ACOS | 30% Margin Result |
|---|---|---|---|
| $10 | $100 | 10% | Profitable (+20%) |
| $25 | $100 | 25% | Profitable (+5%) |
| $30 | $100 | 30% | Break-even |
| $40 | $100 | 40% | Loss (–10%) |
A common mistake is chasing the lowest possible ACOS. A 5% ACOS sounds great until you realize the campaign is spending $5/day and reaching almost no one. Volume matters. The goal is to run at or below break-even ACOS while capturing as much profitable traffic as possible, not to minimize spend.
Pro Tip: Amazon’s attribution window defaults to 14 days for Sponsored Products. If you check ACOS on day 3 of a campaign, you’re looking at incomplete data. Pull ACOS reports after the full attribution window closes, or you’ll see inflated numbers that normalize later.
What is ROAS and when should you use it?
ROAS (Return on Ad Spend) flips the fraction. Instead of cost as a percentage of revenue, it shows revenue as a multiple of cost:
ROAS = Ad-Attributed Revenue ÷ Ad Spend
Same $25 spend, same $100 revenue: ROAS = 4.0. You earned $4 for every $1 spent. Higher is better, and the relationship back to ACOS is always: ROAS = 100 ÷ ACOS%.

When ROAS is the right lens
Marketing teams prefer ROAS for cross-channel reporting because it’s a like-for-like revenue multiple. If your Amazon campaigns run at 4.0 ROAS and your Google Shopping campaigns run at 3.2 ROAS, you can compare them directly without converting percentages. Finance teams and executives also tend to think in multiples rather than cost percentages, so ROAS translates faster in a slide deck.
ROAS is also more intuitive for scaling decisions. If a campaign is running at 6.0 ROAS and your break-even is 3.3 ROAS (equivalent to 30% break-even ACOS), you have room to increase bids and capture more volume before hitting unprofitability.
- Use ROAS for: cross-channel comparisons, executive reporting, scaling decisions, portfolio-level budget allocation
- Use ACOS for: daily campaign management, margin checks, bid target-setting, profitability audits
The blind spot ROAS creates
ROAS hides profitability unless you know your margin. A 5.0 ROAS sounds excellent. But if your product margin is only 15% (meaning break-even ROAS is 6.7), that 5.0 ROAS campaign is losing money on every sale. Always anchor ROAS to a margin-derived target before drawing conclusions.
How ACOS and ROAS convert into each other
The conversion is mechanical: ROAS = 100 ÷ ACOS%, and ACOS% = 100 ÷ ROAS. No rounding, no estimation. Common pairs that come up in practice:
| ACOS | ROAS | Interpretation |
|---|---|---|
| 10% | 10.0 | Highly efficient; check for volume constraints |
| 20% | 5.0 | Strong; viable for most margin profiles |
| 25% | 4.0 | Solid benchmark; profitable at 30%+ margin |
| 30% | 3.3 | Marginal; only profitable above 30% margin |
| — | — | Loss territory for most products |
| 100% | — | Break-even on revenue; pure loss after COGS |
Use this table to sanity-check your reporting. If your dashboard shows a 4.5 ROAS but your ACOS reads 30%, something is off — those numbers should reconcile to 22% ACOS at 4.5 ROAS. Attribution window mismatches and reporting lag are the usual culprits.
Converting margin to a campaign target (step by step)
- Calculate your net margin: Revenue minus COGS, Amazon fees, FBA fees, and shipping.
- Express that as a percentage: $30 profit on a $100 item = 30% margin.
- Set break-even ACOS at 30% (your margin ceiling).
- Convert to a ROAS target: 100 ÷ 30 = 3.33 ROAS minimum.
- Set your bid targets to stay below that ACOS / above that ROAS.
ACOS is the native metric inside Amazon’s advertising console, so most sellers find it easier to set bid targets in ACOS terms and report out in ROAS for stakeholders. Both approaches work — the math is identical.
Why TACoS gives you a picture ACOS and ROAS can’t
ACOS and ROAS only count ad-attributed sales. TACoS (Total Advertising Cost of Sales) measures ad spend against your total revenue, including organic:
TACoS = (Ad Spend ÷ Total Revenue) × 100
Here’s why that distinction matters. Suppose you spend $25 on ads, those ads generate $100 in attributed sales, but your total store revenue that day is $400 (the other $300 came from organic search). Your ACOS is still 25%, but your TACoS is 6.25%. That gap tells you ads are driving a much smaller share of total business than ACOS alone suggests.
TACoS reveals portfolio effects that ACOS and ROAS miss entirely. The most useful signal: if TACoS is falling while total revenue is growing, your ads are lifting organic rank. You’re getting more sales without proportionally more spend. That’s the compounding effect serious sellers watch for.
Signals TACoS surfaces that ACOS and ROAS can’t:
- Falling TACoS + rising revenue: ads are building organic momentum
- Rising TACoS + flat revenue: ads are substituting for organic, not adding to it
- Stable TACoS + rising ACOS: organic is declining; ads are compensating
- Low ACOS but high TACoS: high ad dependency; organic rank may be weak
How to lower ACOS and raise ROAS in practice
Both metrics respond to the same levers. The difference is which side of the fraction you’re moving: reduce the numerator (ad spend) or increase the denominator (revenue).
-
Align bids to your break-even ACOS. Set keyword-level bids based on your margin target, not on Amazon’s suggested bid. If your break-even ACOS is 28%, your bid should reflect the conversion rate and average order value that keeps you at or below that ceiling. Amazon’s guidance ties this directly to margin.
-
Tighten match types and add negative keywords. Broad match keywords generate impressions and clicks that rarely convert. Moving high-spend, low-converting search terms to exact match or negating them reduces wasted spend without touching revenue. This is usually the fastest ACOS improvement available.
-
Fix listing conversion rate. A 5% conversion rate versus a 10% conversion rate on the same traffic doubles your ROAS without changing your bids. Images, bullet points, A+ content, and reviews all affect conversion. Listing quality is an underused ROAS lever.
-
Restructure campaigns by intent. Mixing branded, category, and competitor keywords in one campaign makes it impossible to set appropriate bids. Separate them. Branded keywords typically convert at higher rates and warrant different ACOS targets than cold-traffic category terms.
-
Test changes on a controlled cohort and measure over multiple weeks. Single-day ACOS swings are noise. A bid change needs at least two to three weeks of data before you can tell whether it improved efficiency or just caught a slow traffic day.
Pro Tip: Never optimize off a single day’s ACOS. Pull a 14–21 day rolling window before making bid decisions. A campaign that looks broken on Tuesday often looks fine by the following Monday once the attribution window fills in.
How AI tools help you track and improve ACOS and ROAS
Manual campaign management at scale means checking dozens of keywords, campaigns, and match types across multiple ASINs. The math is simple; the volume isn’t. Automation reduces the noise and enforces consistency in a way spreadsheets can’t.
A credible AI PPC tool should do four things:
- Identify high-spend, low-return pockets — campaigns or keywords where ACOS is well above break-even and spend is material
- Give a clear, data-justified recommendation for each flagged item (raise bid, lower bid, negate, harvest)
- Apply changes with one click and log what was changed and when
- Track the outcome over a defined window before flagging the next change
That last point is where most tools fall short. Selloop tracks the results of every recommended change over a 21-day window to confirm whether the adjustment actually moved ACOS or ROAS in the right direction. That measurement window matters because it’s long enough to smooth attribution noise and short enough to keep optimization moving.
Selloop’s 21-day tracking approach is built around one principle: a change isn’t validated until you’ve seen it through a full attribution cycle. Sellers who optimize weekly off incomplete data often undo improvements before they’ve had time to register.
The campaign health scoring Selloop provides gives each campaign a structured grade, so sellers know which campaigns need attention first rather than reviewing everything at once. For sellers managing 10+ campaigns, that prioritization alone saves hours per week.
Key Takeaways
ACOS and ROAS are the same efficiency signal expressed differently: use ACOS to check profitability against your margin and ROAS to compare performance across channels or make scaling decisions.
| Point | Details |
|---|---|
| ACOS and ROAS are inverses | ROAS = 100 ÷ ACOS%; a 25% ACOS always equals a 4.0 ROAS. |
| Break-even ACOS drives targets | Set your ACOS ceiling from net margin (after COGS, fees, and shipping), not from benchmarks. |
| TACoS reveals organic impact | TACoS = ad spend ÷ total revenue; falling TACoS with rising revenue signals organic lift from ads. |
| Optimize over 14–21 days | Single-day ACOS swings are attribution noise; validate changes over a full measurement window. |
| Selloop automates the cycle | Selloop detects wasted spend, recommends changes with data justification, and tracks outcomes over 21 days. |
The metric that actually matters is the one tied to your margin
Most guides on ACOS vs ROAS spend too much time on the formulas and not enough on the decision that precedes them: do you know your break-even ACOS? If you don’t, neither metric tells you anything useful. A 20% ACOS is excellent for a product with 35% margin and a disaster for one with 18% margin.
The conventional advice to “aim for a low ACOS” is backwards. You should aim for the highest ACOS that still keeps you profitable, because that’s the point where you’re capturing maximum volume without losing money. Sellers who chase 10% ACOS on a product with 40% margin are leaving profitable sales on the table.
ROAS is genuinely useful, but mostly for the conversations you have outside the Amazon console. When you’re reporting to a business partner, comparing Amazon to Meta spend, or deciding where to allocate budget across channels, ROAS is the cleaner number. Inside Amazon, ACOS maps directly to margin, and that’s where the real decisions happen.
One more thing: a high ROAS on a low-volume campaign is not a success signal. A campaign spending $5/day at 8.0 ROAS is contributing almost nothing to your business. Check absolute revenue and TACoS before reallocating budget toward a “winner” that’s barely running.
Selloop spots the ACOS problems you’re too busy to find
Knowing the formulas is the easy part. The hard part is reviewing 30 campaigns, 400 keywords, and a week of search term data every time you want to make a bid decision. That’s where most sellers either give up or make changes based on gut feel rather than data.
Selloop analyzes your Sponsored Products and Sponsored Brands campaigns, flags the keywords and campaigns where ACOS is above your break-even, and tells you exactly what to change and why. Each recommendation comes with the data behind it. You approve with one click, Selloop applies the change on Amazon, and tracks the result over 21 days so you know whether it worked.
Plans start at €29/month with a 7-day free trial. No agency fees, no long-term contract, no spreadsheet required. If you’re spending on Amazon ads and not sure whether they’re profitable, that’s the right place to start.
Useful sources
These are the primary references used throughout this guide:
- What is advertising cost of sales (ACOS)? Calculation and tips | Amazon Ads — Amazon’s official documentation on ACOS, break-even calculation, and how ROAS and ACOS relate
- ACOS vs ROAS: Which Amazon PPC Metric Should You Track? | WisePPC — practical conversion table, cross-channel ROAS use cases, and TACoS context
- ACOS Meaning for Amazon Sellers | AMZBase — TACoS formula, portfolio-level measurement, and organic lift signals
- What Is ACOS in Amazon Ads? The Honest Math | BTB Audits — explanation of why ACOS is Amazon’s native metric and how it maps to margin
- RoAS vs ACoS: Does Amazon’s embrace of RoAS make ACoS obsolete? | Nozzle — analysis of ROAS as an additive reporting layer rather than a replacement for ACOS